Establishment of CCL4-induced liver fibrosis model

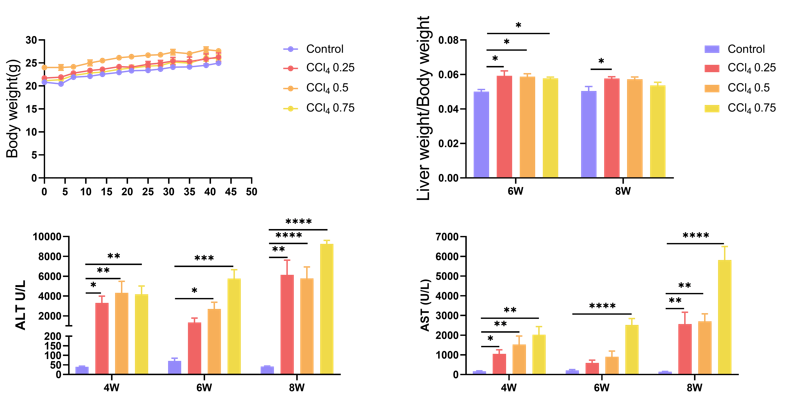
Liver weight, body weight, ALT and AST levels in serum were detected after CCl4 induction. Values are expressed as mean ± SEM. *p<0.05, **p<0.01, ***p<0.001, ****p<0.0001.

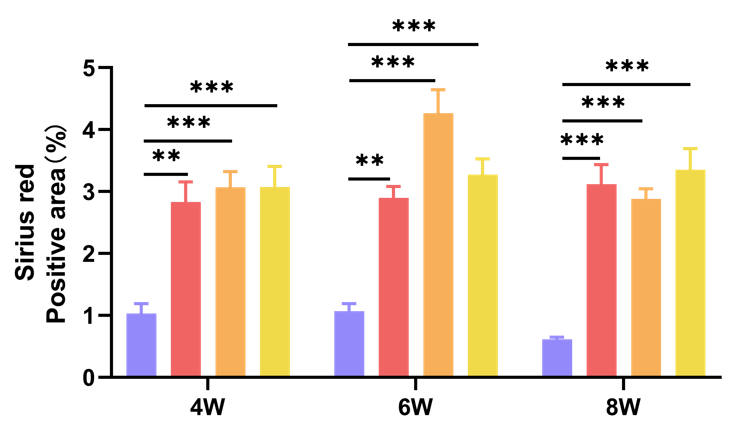
H&E staining showing inflammation infiltration and Sirius red staining showing fibrosis in liver. Values are expressed as mean ± SEM. **p<0.01, ***p<0.001.
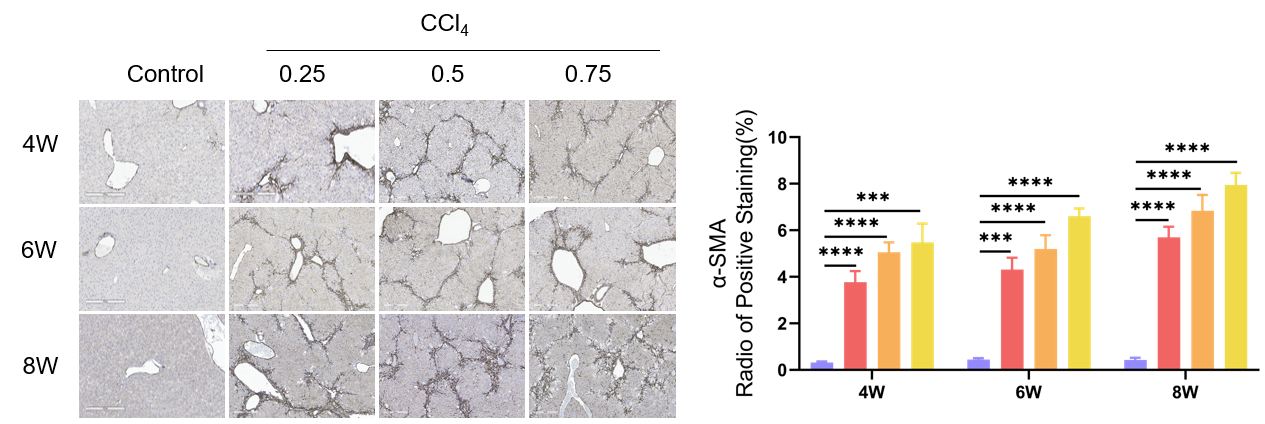
Immunohistochemistry showing fibroblast marker α-SMA in liver. Values are expressed as mean ± SEM. ***p<0.001, ****p<0.0001.
Efficacy Validation on liver fibrosis Mouse Models for OCA (Obeticholic Acid)

(A) Representative pictures of Sirius red staining showing liver fibrosis after 3 weeks of CCl4 induction and OCA treatment. (B) Statistic data of Sirius red staining. Values are expressed as mean ± SEM. *p<0.05.
Establishment of Bile duct ligation induced liver fibrosis model

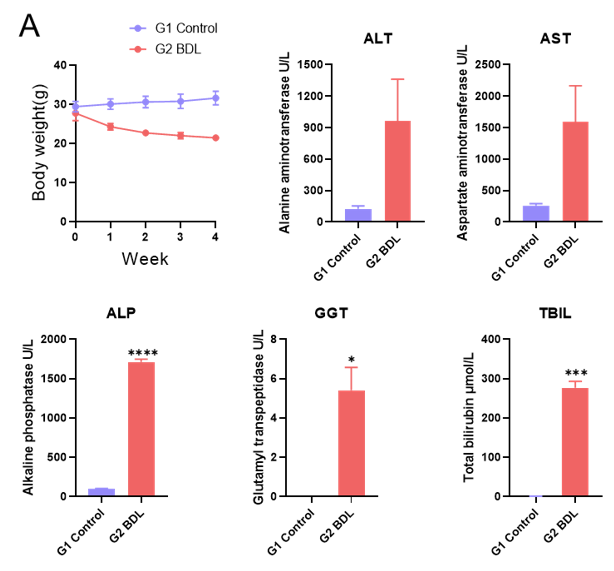
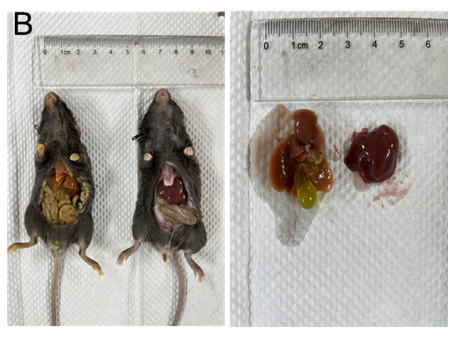
Liver fibrosis model by bile duct ligation (A) ALT, AST, ALP, GGT and TBIL levels in serum.(B)Representative appearance of livers 4 weeks after BDL. Values are expressed as mean ± SEM. *p<0.05, ***p<0.001, ****p<0.0001.
Histologic Assessment of Bile duct ligation induced liver fibrosis model
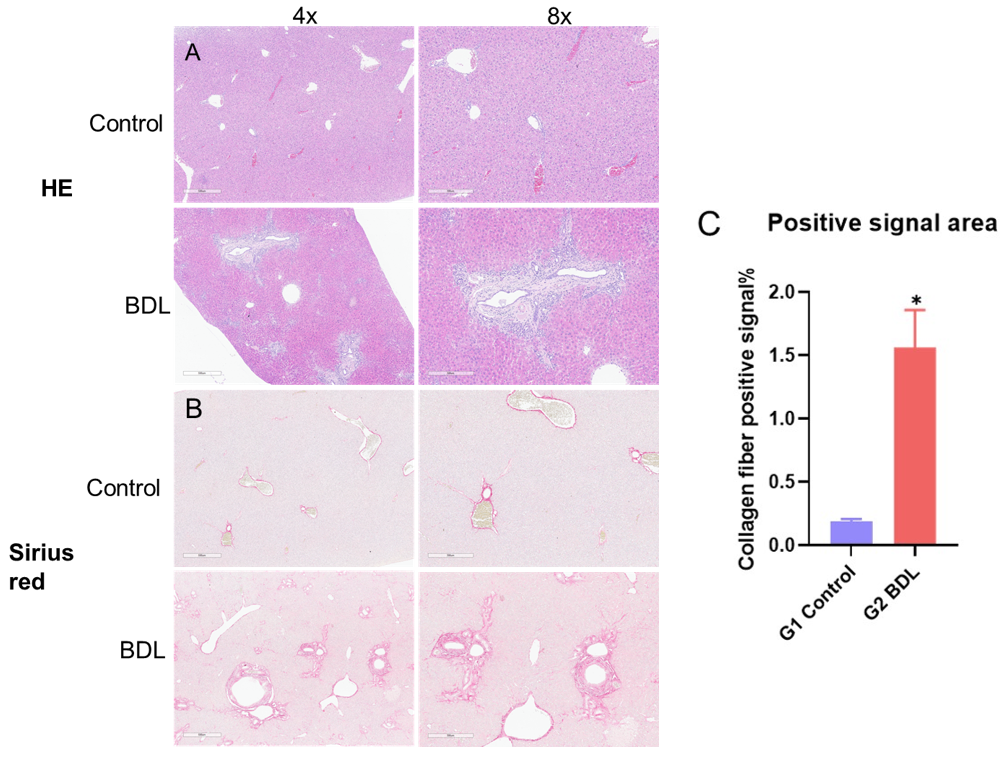
H&E and Sirius red staining after Bile duct ligation 4 weeks (A) Representative pictures of H&E staining. (B) Representative pictures of sirius red staining showing increased liver fibrosis. (C) Positive signal area of collagen fiber. Values are expressed as mean ± SEM. *p<0.05.
Establishment of TAA-induced liver fibrosis model

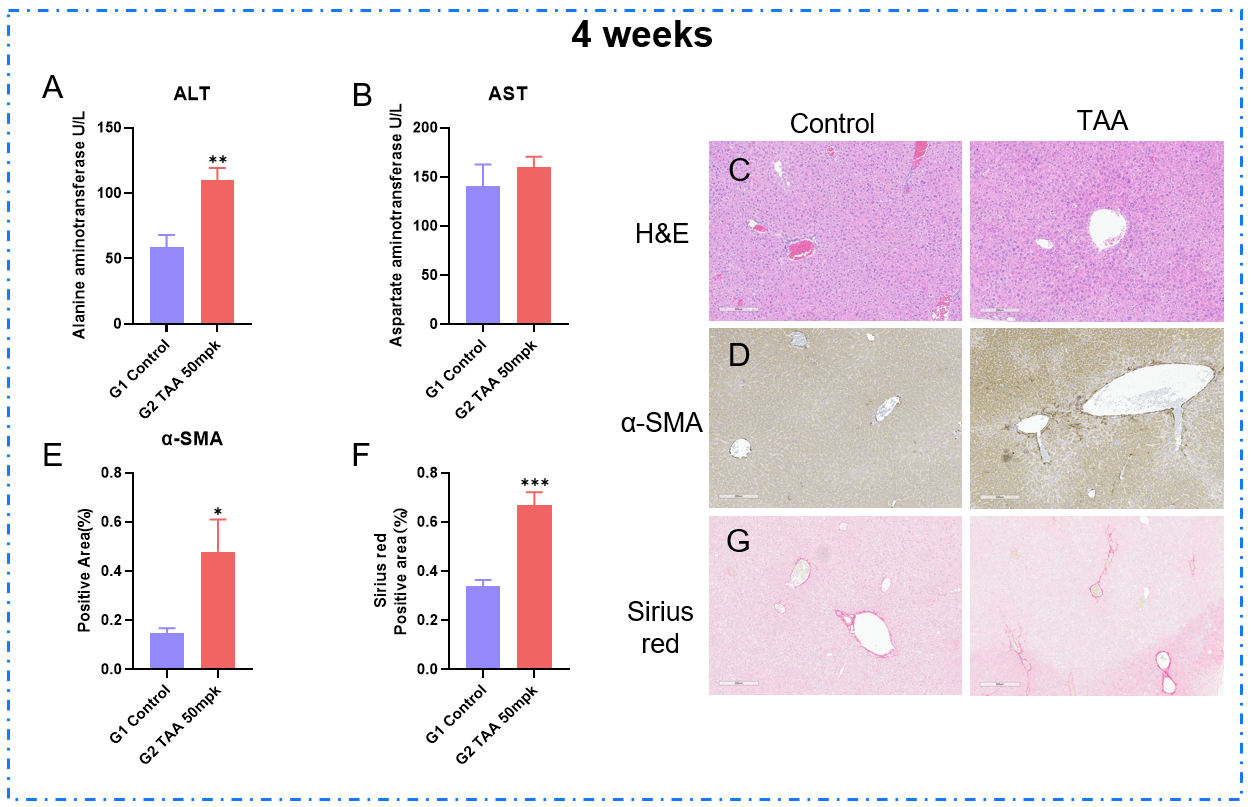
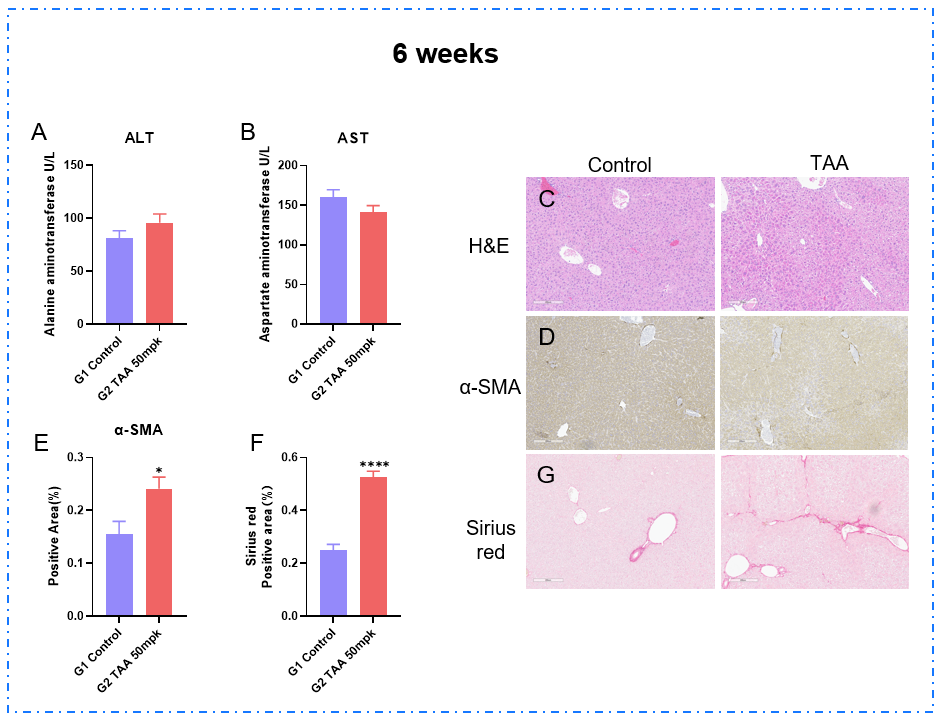
TAA induced liver fibrosis model for 4/6 weeks. (A-B) ALT and AST levels in serum. (C) Representative pictures of H&E staining. (D-E) Representative images of immunohistochemical staining showing α-SMA and positive area(G-F) Representative pictures of sirius red staining showing increased liver fibrosis and positive area. Values are expressed as mean ± SEM. *p<0.05, **p<0.01, ***p<0.001, ****p<0.0001.


